
Welcome To The Piper Sandler Portfolio Strategy Portal!
Our Strategy Portal is a complement to the team’s research product. The portal provides interactive, under-the hood analysis of what is driving market trends below the surface. In addition, the portal includes a myriad of “outside-the-box” risk-management and stock-selection tools for investors with any mandate.
If there’s something specific you’re looking for that’s not listed or if you have any questions or suggestions, please reach out to us at strategy@psc.com. We love to hear feedback!
Monitoring the Markets: Dashboards
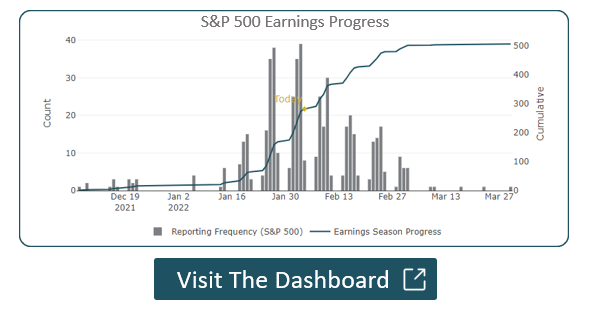
- The VIEW: Valuation & Earnings
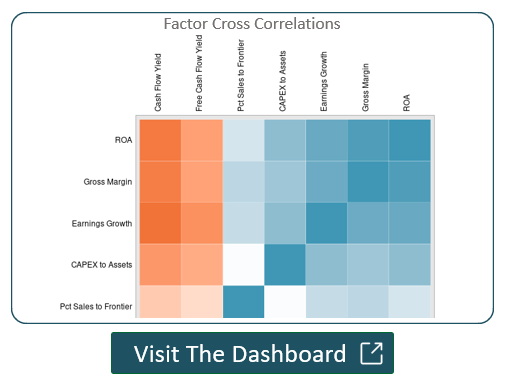
- Factor Dashboard
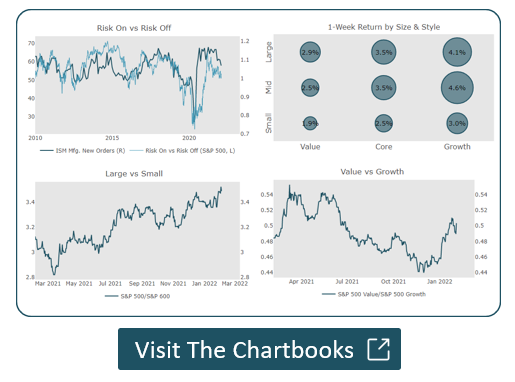
- Chartbook
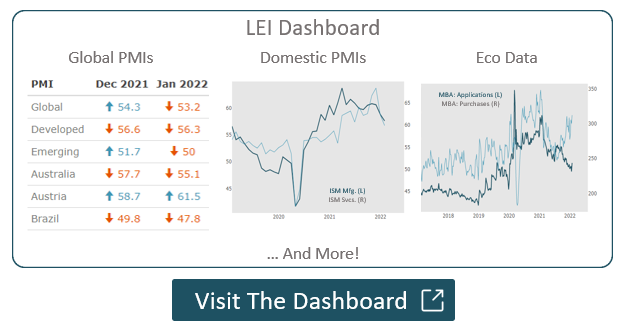
- LEI Dashboard
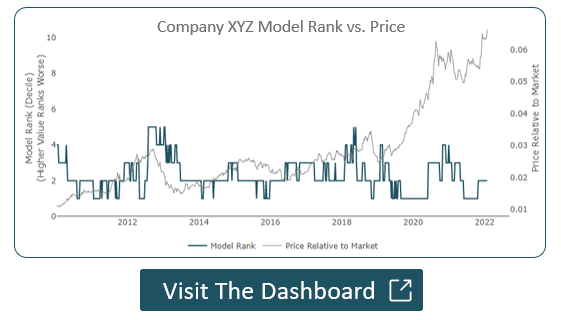
- Model Dashboard
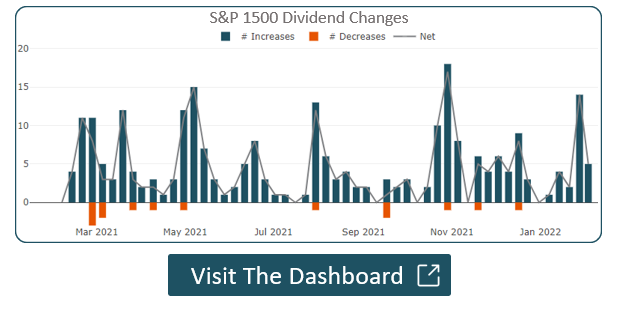
- Dividend Dashboard
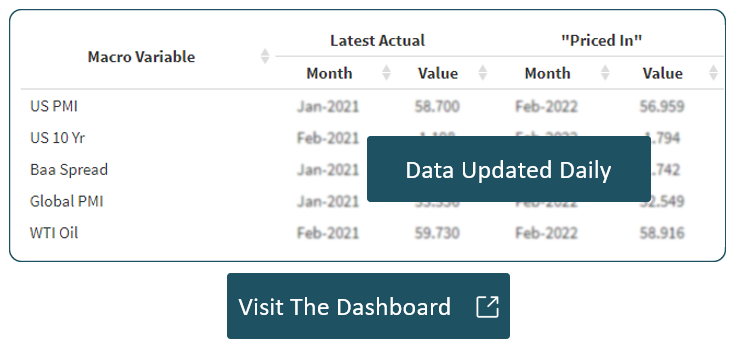
- What's Priced In
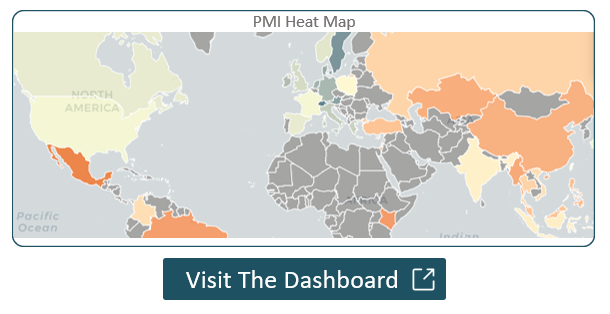
- Global Dashboard
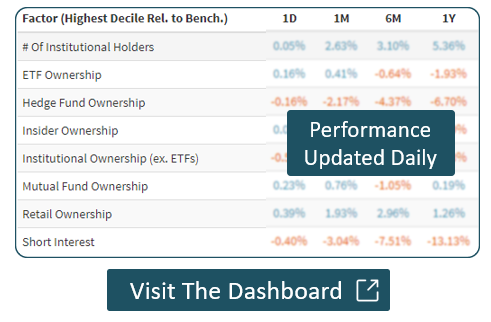
- Ownership Dashboard
(If you wish to use the Legacy Earnings Dashboard, Click Here)
Click here to read our primer report.
Click here to read our primer report.
Click here to read our primer report.
Click here to read our primer report.
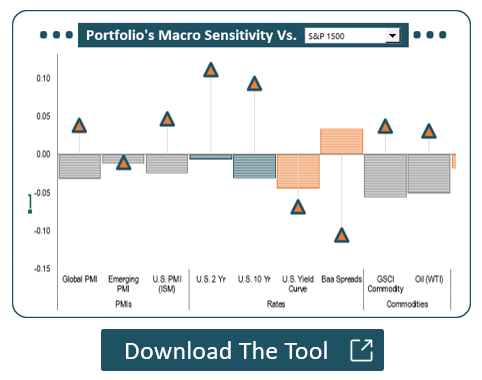
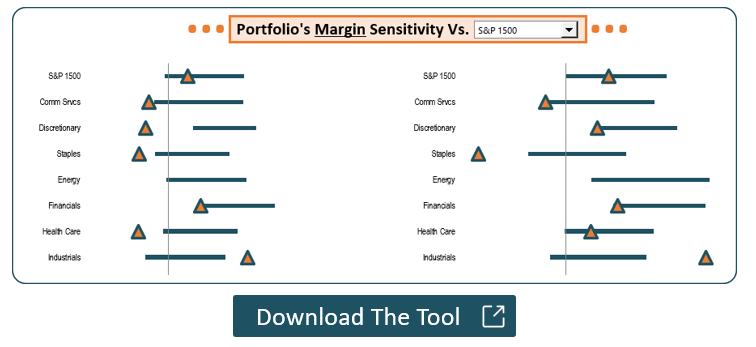
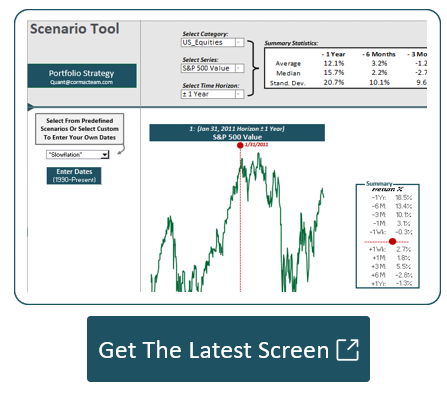
Portfolio Risk Management Suite
Click Here For A Video Walk-Through

Click here to download the latest screen.
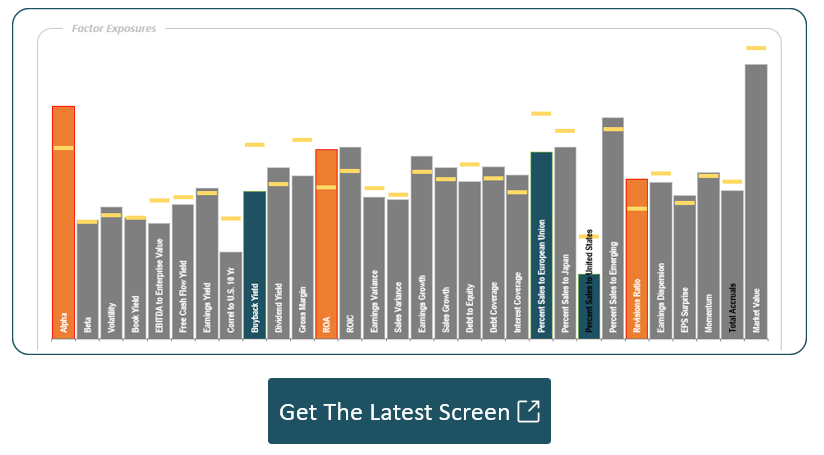
Quantitative Stock Screens
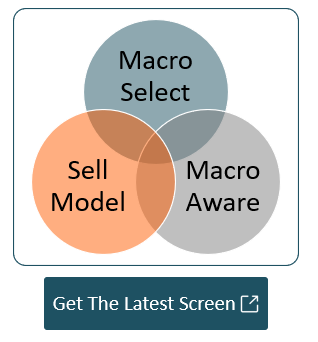
- Model Highlights
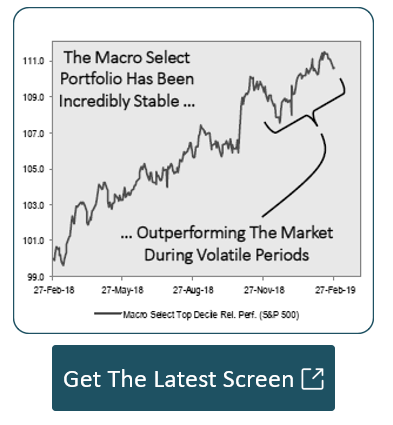
- Macro Select
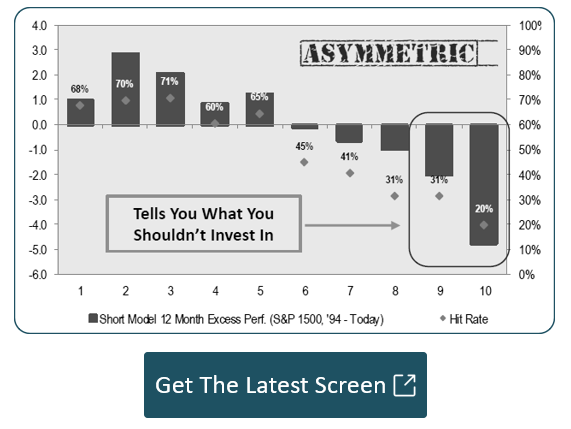
- Sell Model
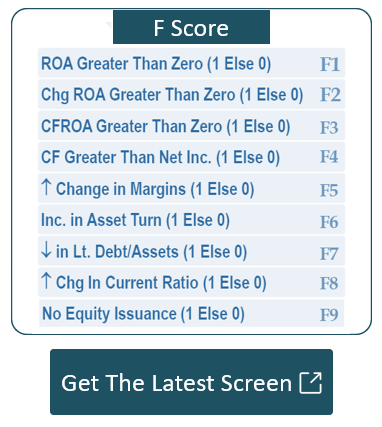
- F Score
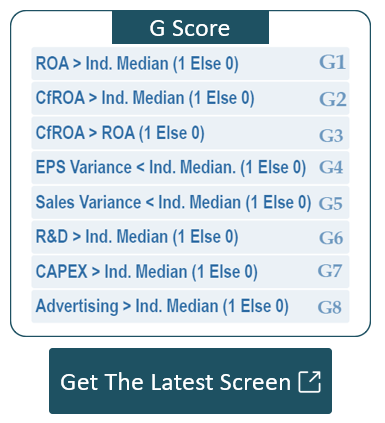
- G Score
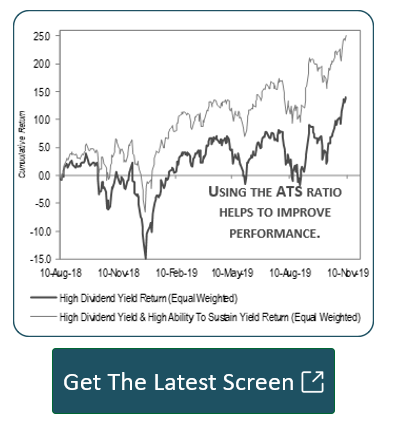
- Ability To Sustain
- Market Cycle
- Credit Model
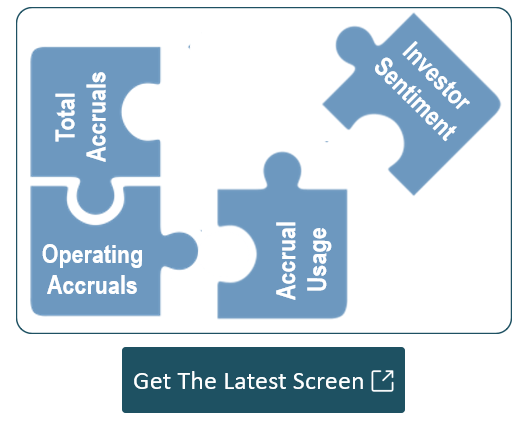
- Accounting Quality
- All Seasons
Click here to download the latest screen.
Click here to download the latest screen.
Click here to read our primer report.
Click here to download the latest screen.
Click here to read our primer report.
Click here to download the latest screen.
Click here to read our primer report.
Click here to download the latest screen.
Click here to read our primer report.
Click here to download the latest screen.
Click here to download the latest screen.

Click here to download the latest screen.

Click here to read our primer report.
Click here to download the latest screen.
Click here to download the latest screen.

Supplemental Resources
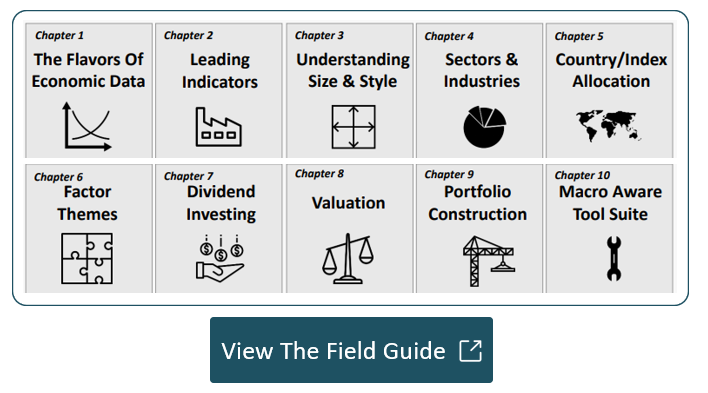
- Field Guide to Macro & Markets
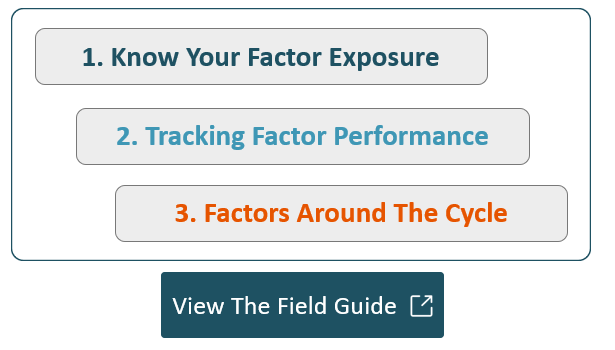
- Field Guide to Factors
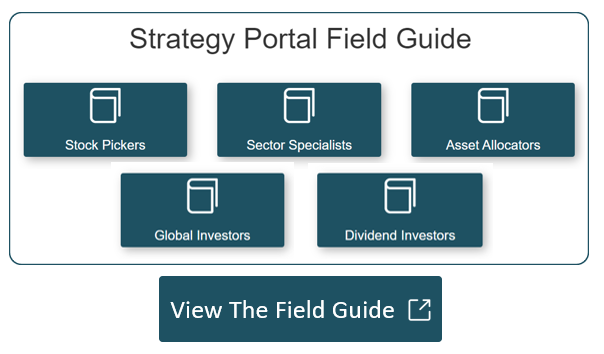
- Field Guide to the Strategy Portal
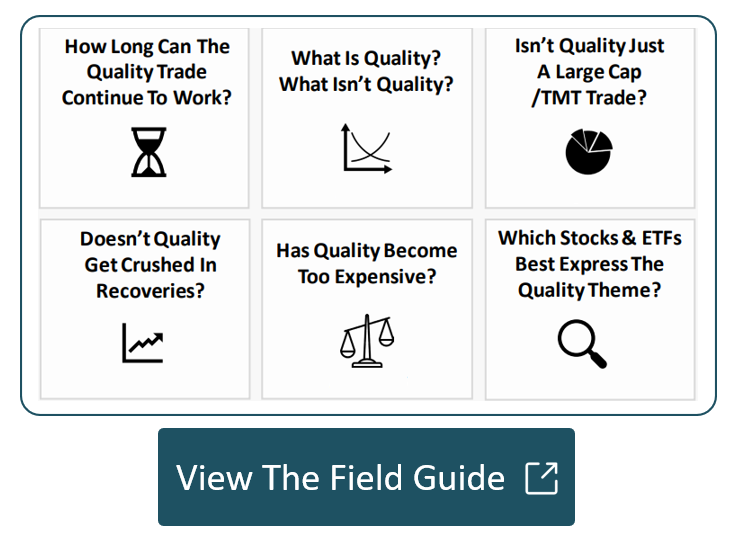
- Field Guide To Quality
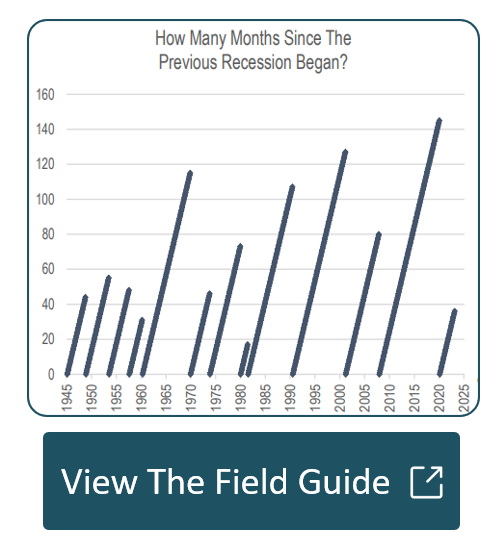
- Field Guide To NBER Recessions
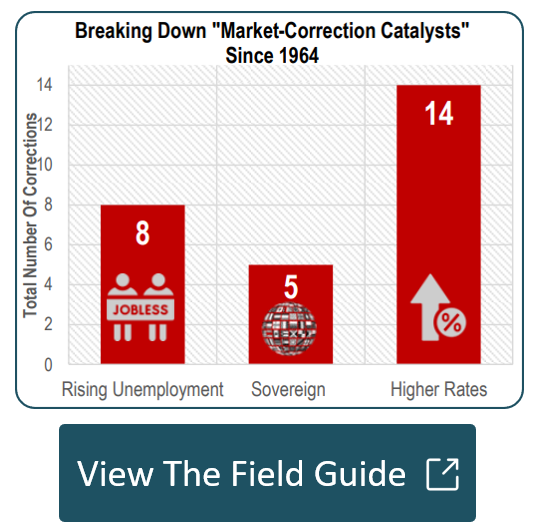
- Field Guide To Market Corrections
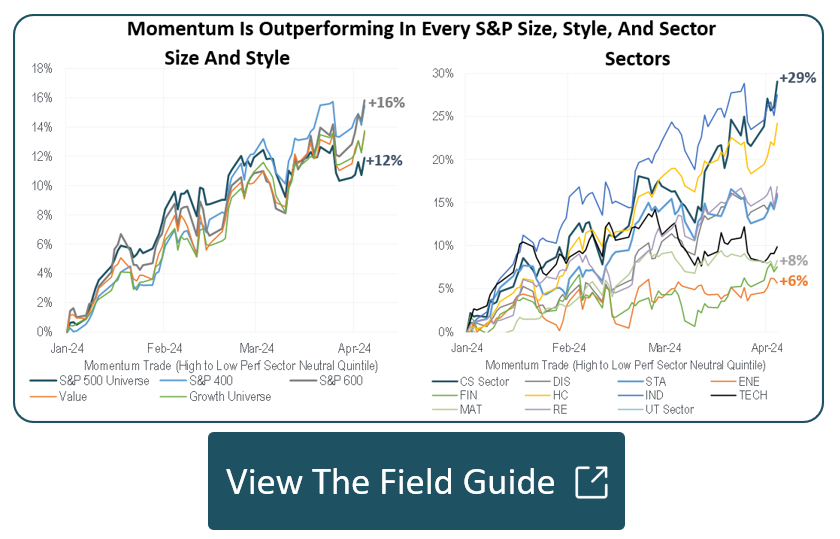
- Field Guide To Momentum
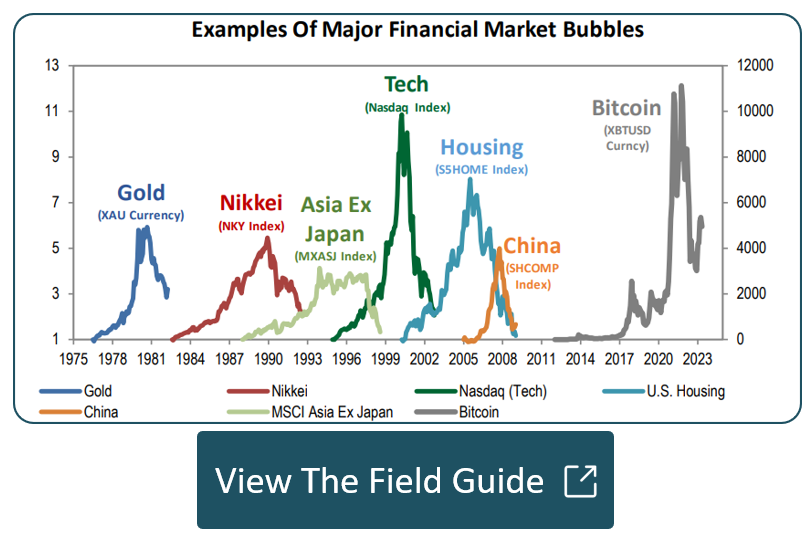
- Field Guide To Asset Bubbles
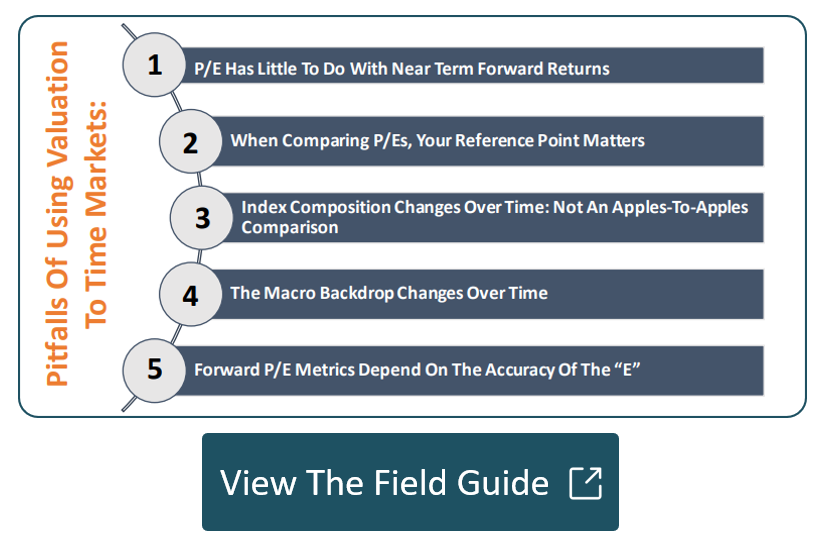
- Field Guide To Valuation
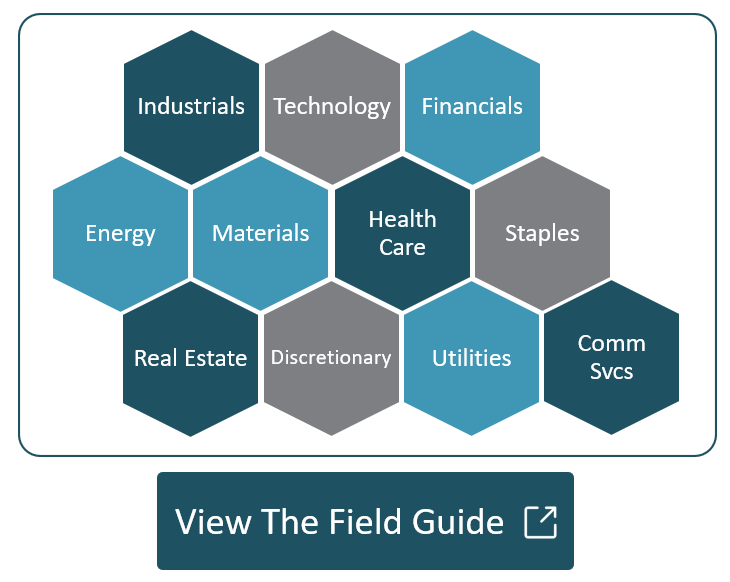
- Field Guide To Sectors
Click here to check out the guide.
Click here to check out the guide.
Click here to check out the guide.
Click here to check out the guide.
Click here to check out the guide.
Click here to check out the guide.
Click here to check out the guide.
Click here to check out the guide.
Click here to check out the guide.
Click here to check out the guide.
Investment Outlook

| Michael Kantrowitz, CFA | Stephen Gregory | Emily Needell, CFA | Joe Ramirez, CFA | Dan Nivasch |
| (212) 257-4971 | (212) 257-4972 | (212) 257-4974 | (212) 257-4975 | (212) 257-4973 |
| michael.kantrowitz@psc.com | stephen.gregory@psc.com | emily.needell@psc.com | joe.ramirez@psc.com | dan.nivasch@psc.com |